📍 East Hampshire District (EHDC)
- 2011 population: 115,608
- 2021 population: 125,700
- Growth:
- Absolute increase: 10,092 people
- Percentage increase: ~8.73%
📎 Source (2021): https://www.ons.gov.uk/visualisations/censuspopulationchange/E07000085/
📎 Source (2011): https://cdn.easthants.gov.uk/public/documents/Census%20infographic%20EHDC.pdf
📍 Medstead (Civil Parish)
- 2011 population: 2,036
- 2021 population: 3,016
- Growth:
- Absolute increase: 980 people
- Percentage increase: ~48.14%
📎 Source: https://www.citypopulation.de/en/uk/southeastengland/admin/east_hampshire/E04004515__medstead/
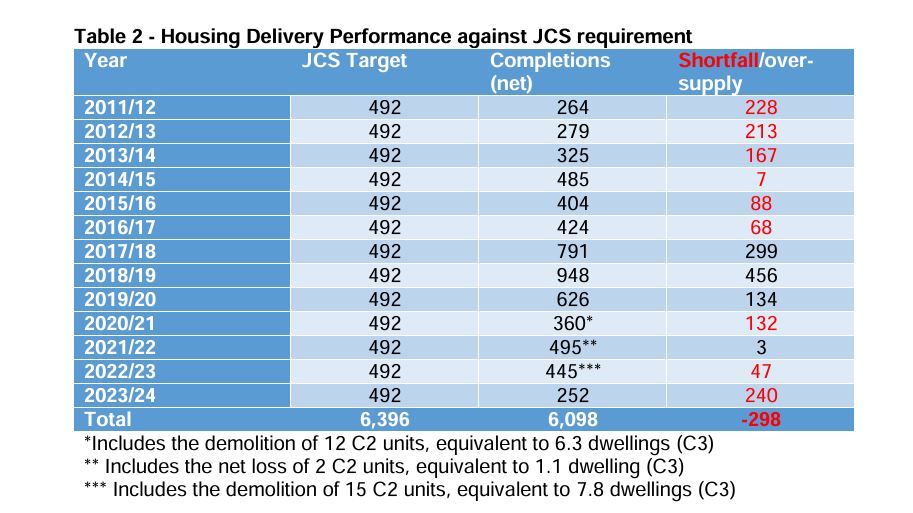
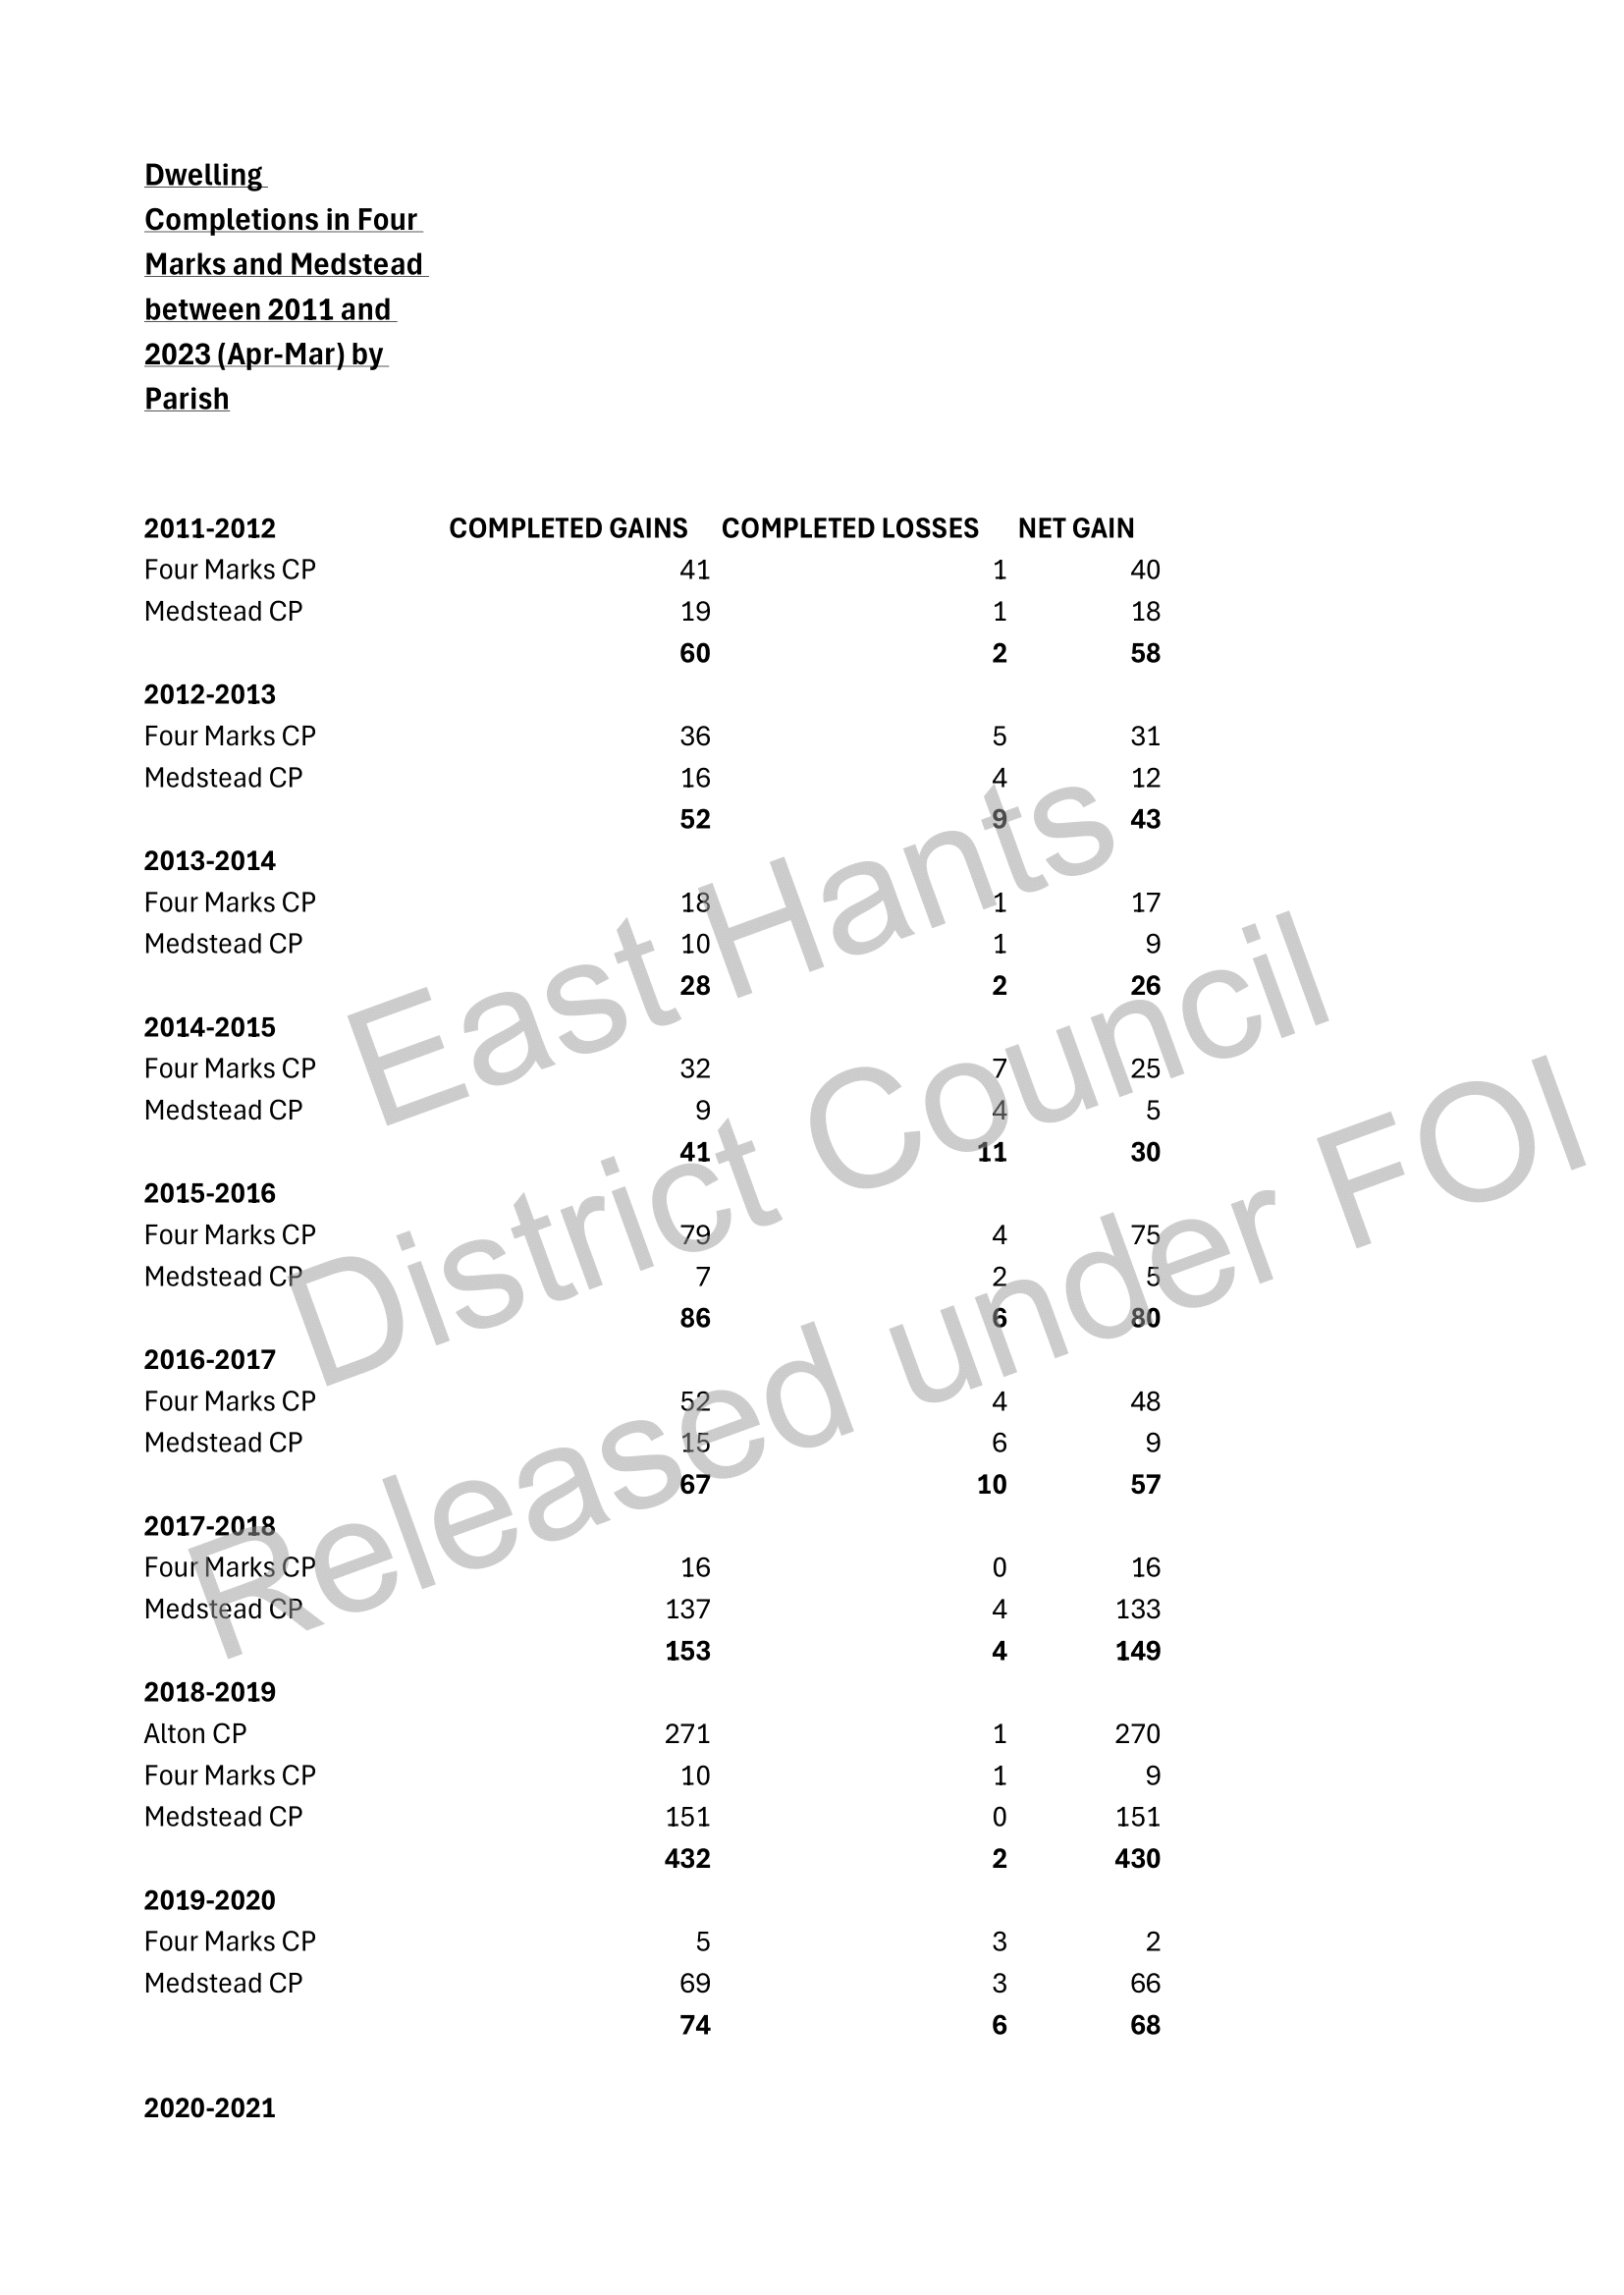
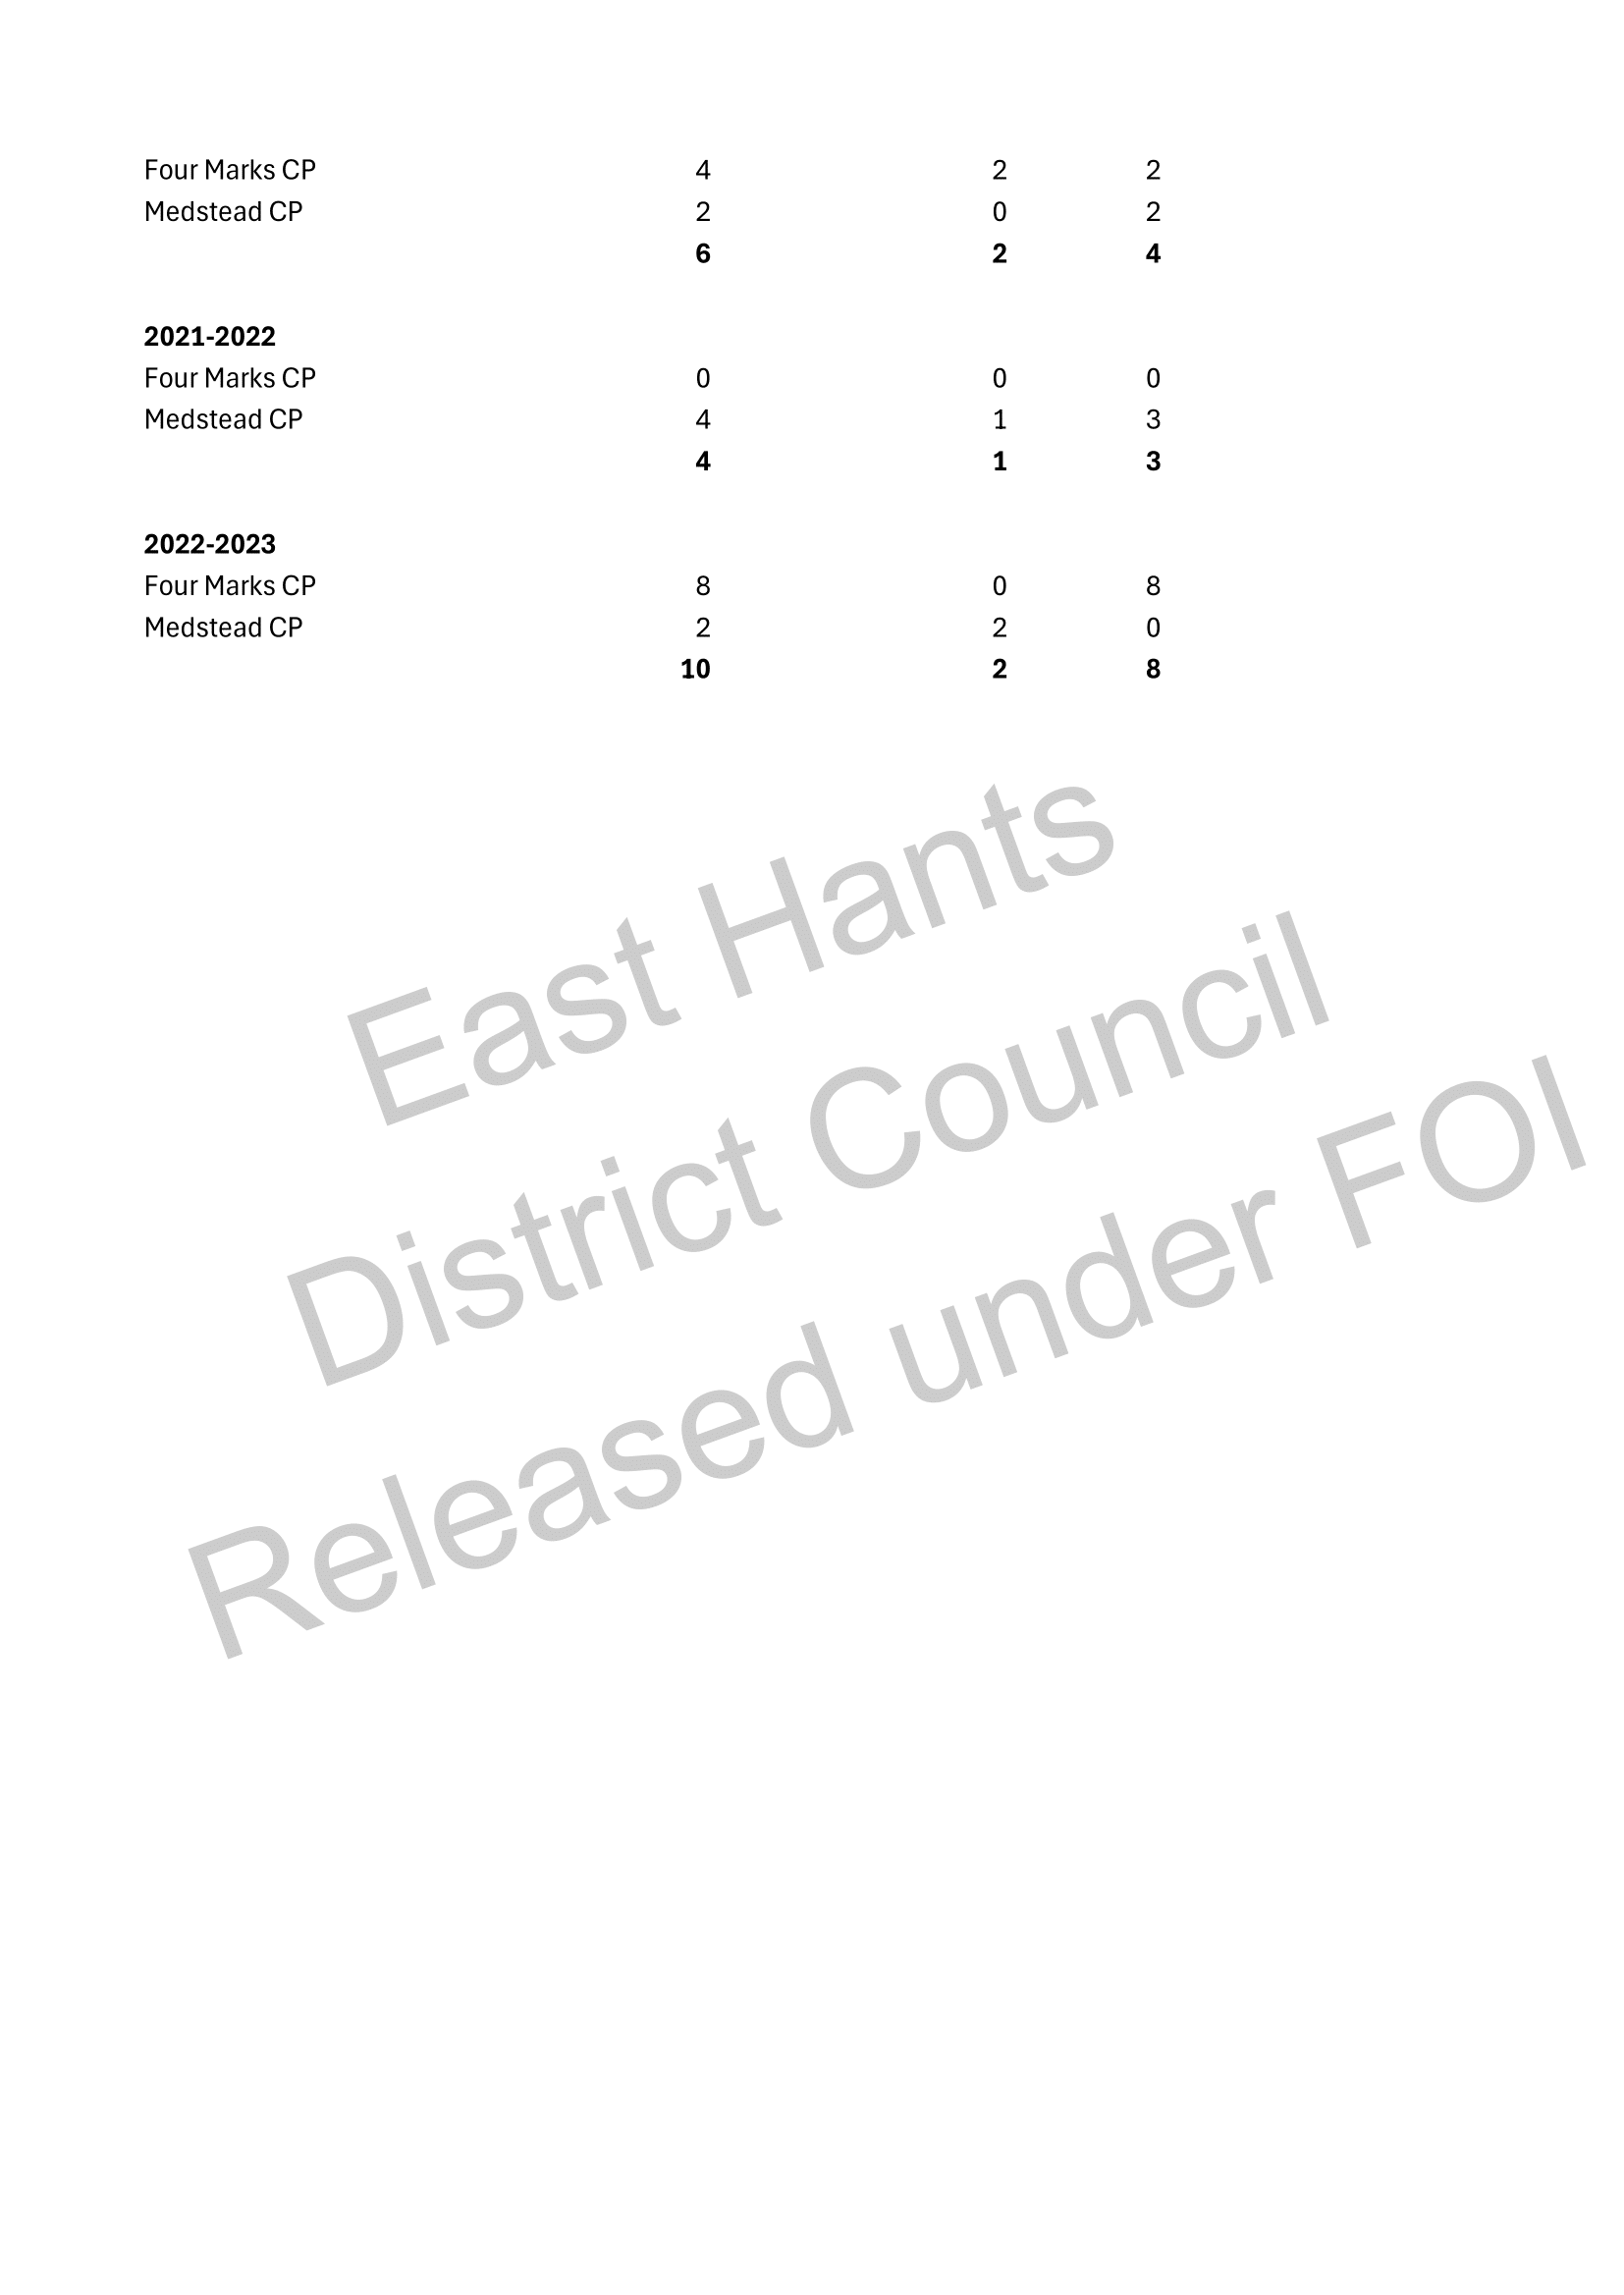
📊 Proportionality of Development in Medstead (2011–2021)
- Dwelling completions in Medstead (net gain): 410
- Dwelling completions across East Hampshire District (EHDC): 4,906
- ➤ Medstead accounted for ~8.36% of all new dwellings in EHDC
👥 Population Context (2011 Census)
- Medstead population (2011): 2,036
- EHDC population (2011): 115,608
- ➤ Medstead represented just ~1.76% of EHDC’s total population
⚖️ Conclusion: Disproportionate Development
Despite making up only 1.76% of the district’s population, Medstead absorbed 8.36% of all new housing in the 2011–2021 period.
This shows a development burden over four times higher than what would be expected if housing were distributed in proportion to population size.
📌 This is strong, quantitative evidence that development in Medstead was not proportionate. It supports arguments about infrastructure strain, planning fairness, and unsustainable growth at the local level.