 East Hampshire District (EHDC)
- 2011 population: 115,608
- 2021 population: 125,700
- Growth:
- Absolute increase: 10,092 people
- Percentage increase: ~8.73%
 Source (2021): https://www.ons.gov.uk/visualisations/censuspopulationchange/E07000085/ Source (2011): https://cdn.easthants.gov.uk/public/documents/Census%20infographic%20EHDC.pdf
Medstead (Civil Parish)
- 2011 population: 2,036
- 2021 population: 3,016
- Growth:
- Absolute increase: 980 people
- Percentage increase: ~48.14%
Source: https://www.citypopulation.de/en/uk/southeastengland/admin/east_hampshire/E04004515__medstead/
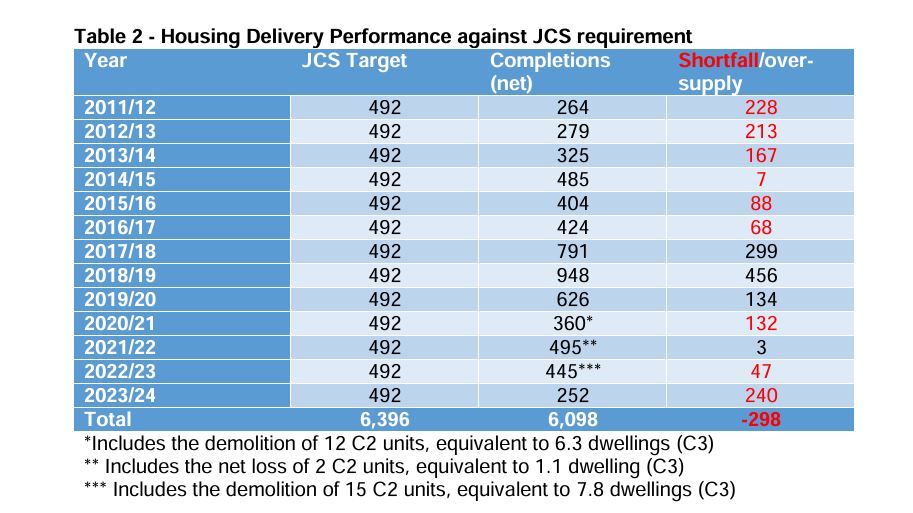
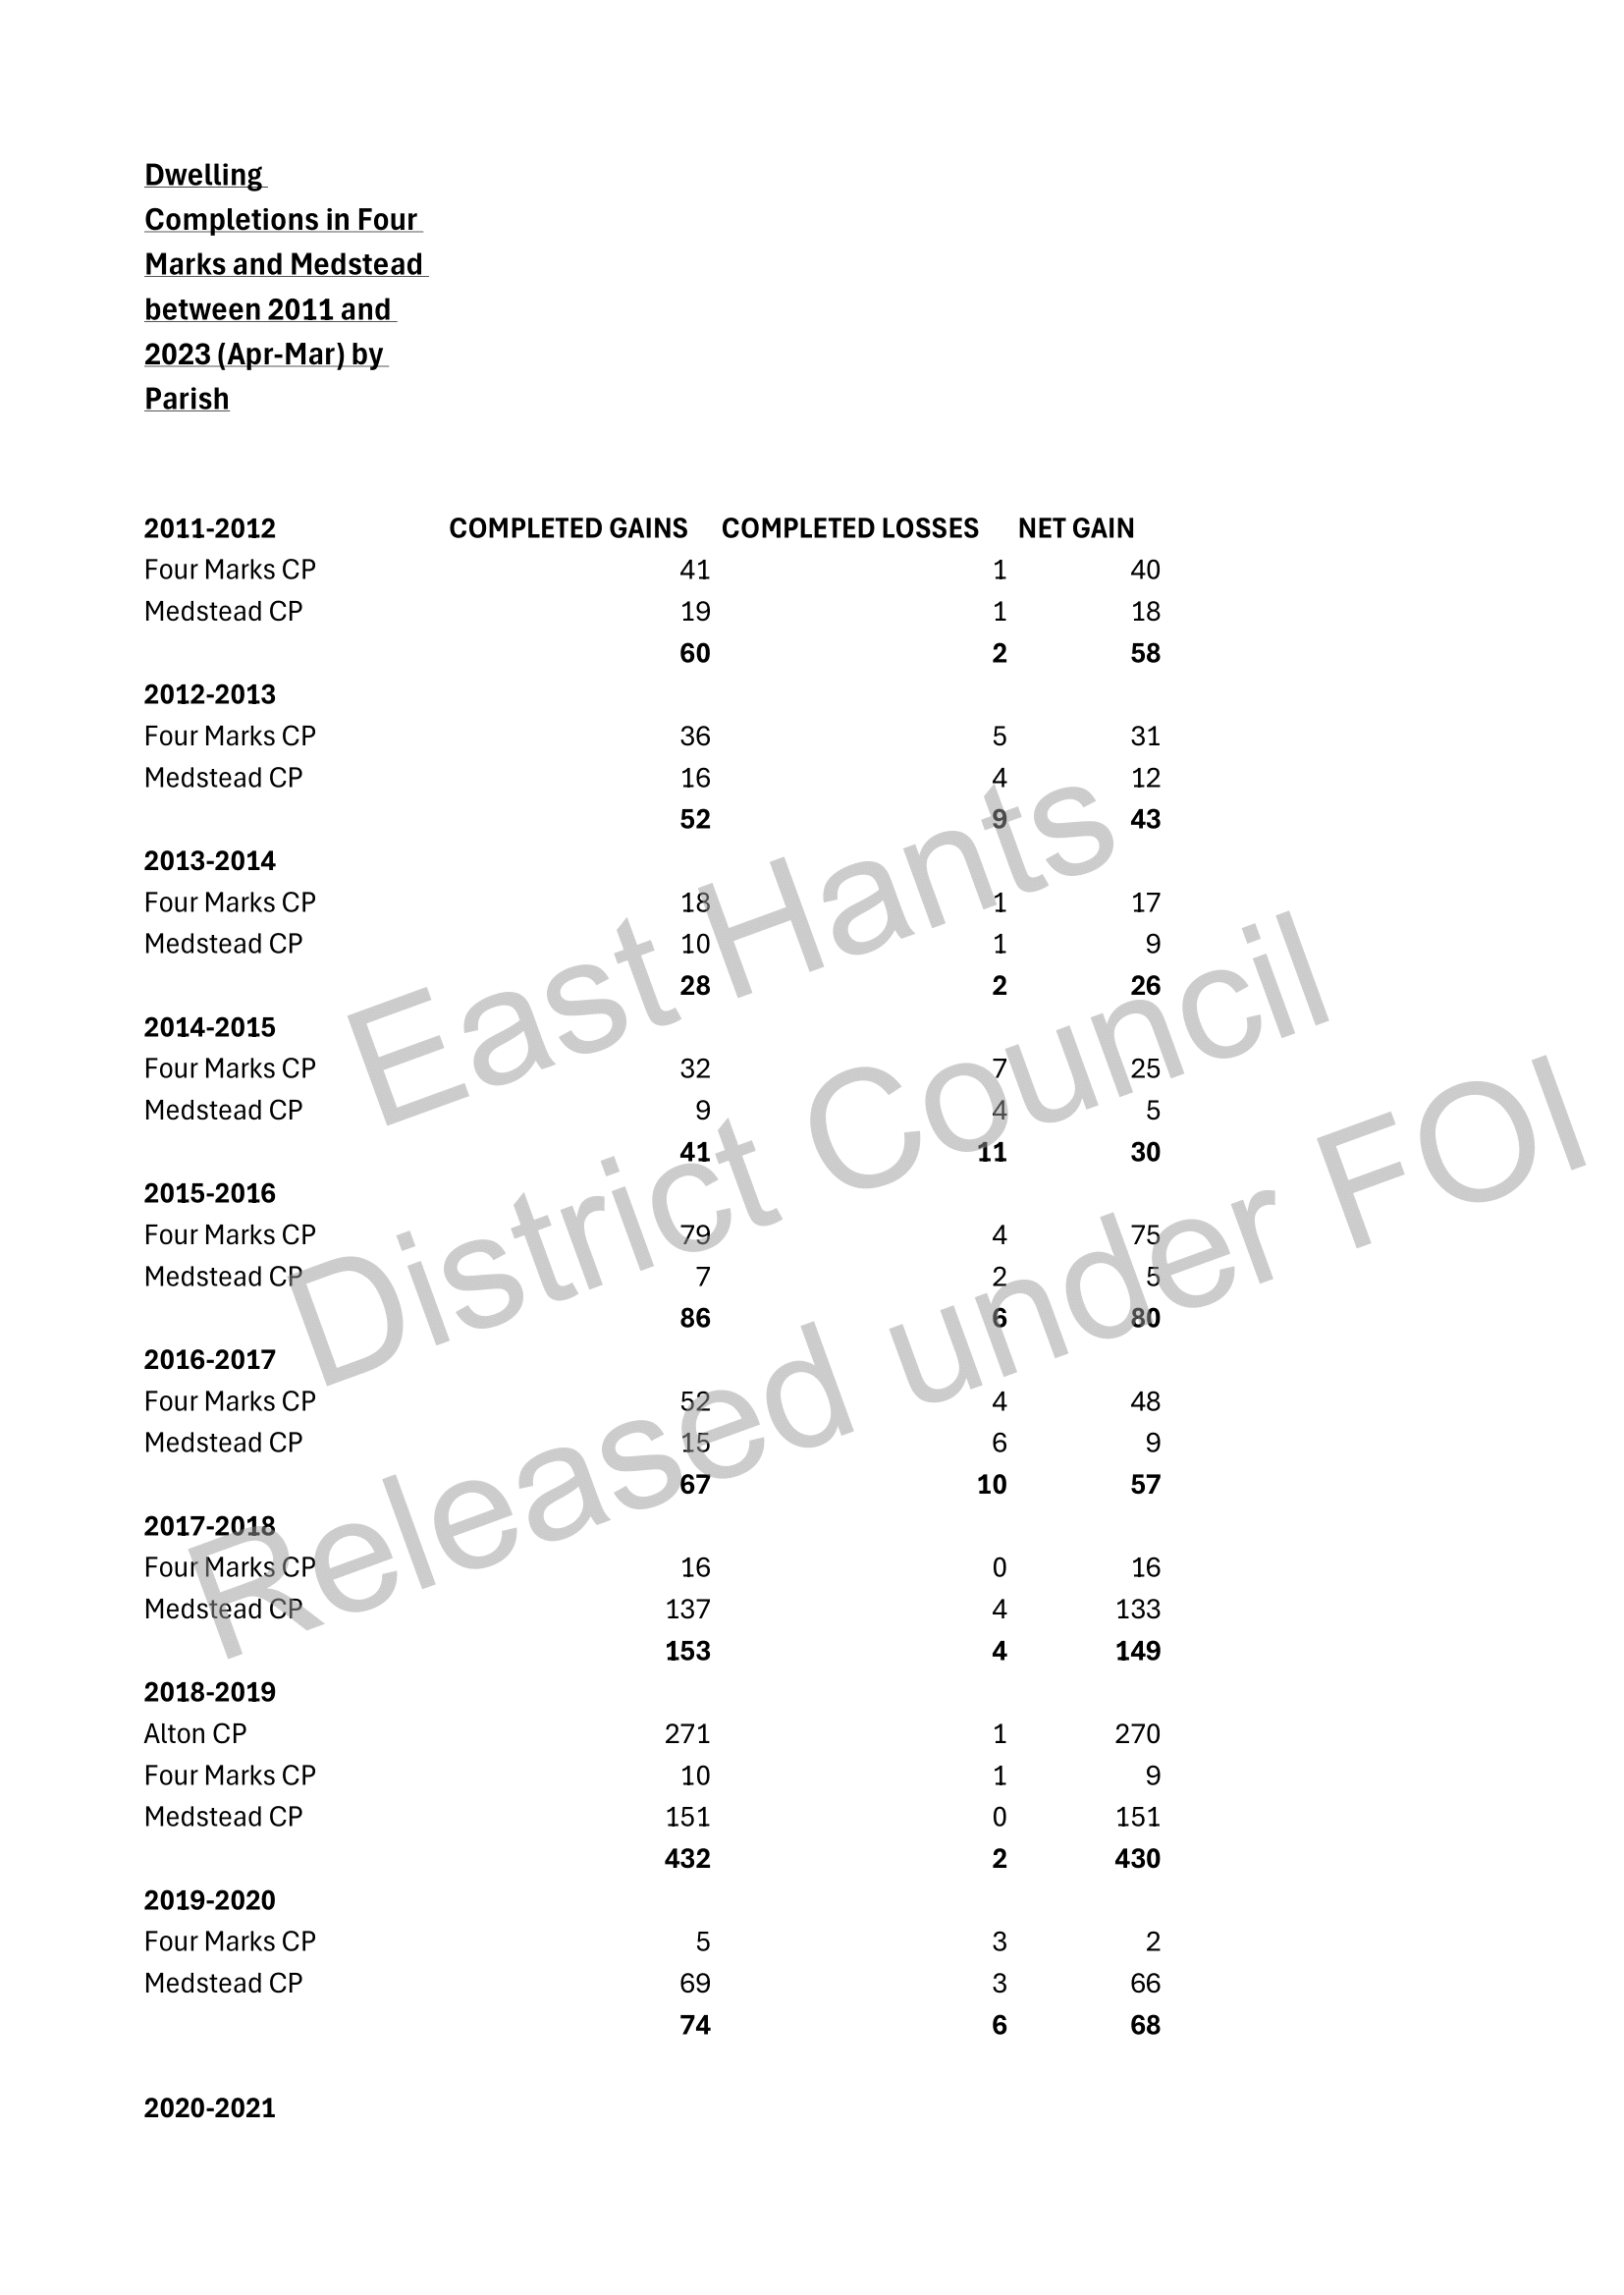
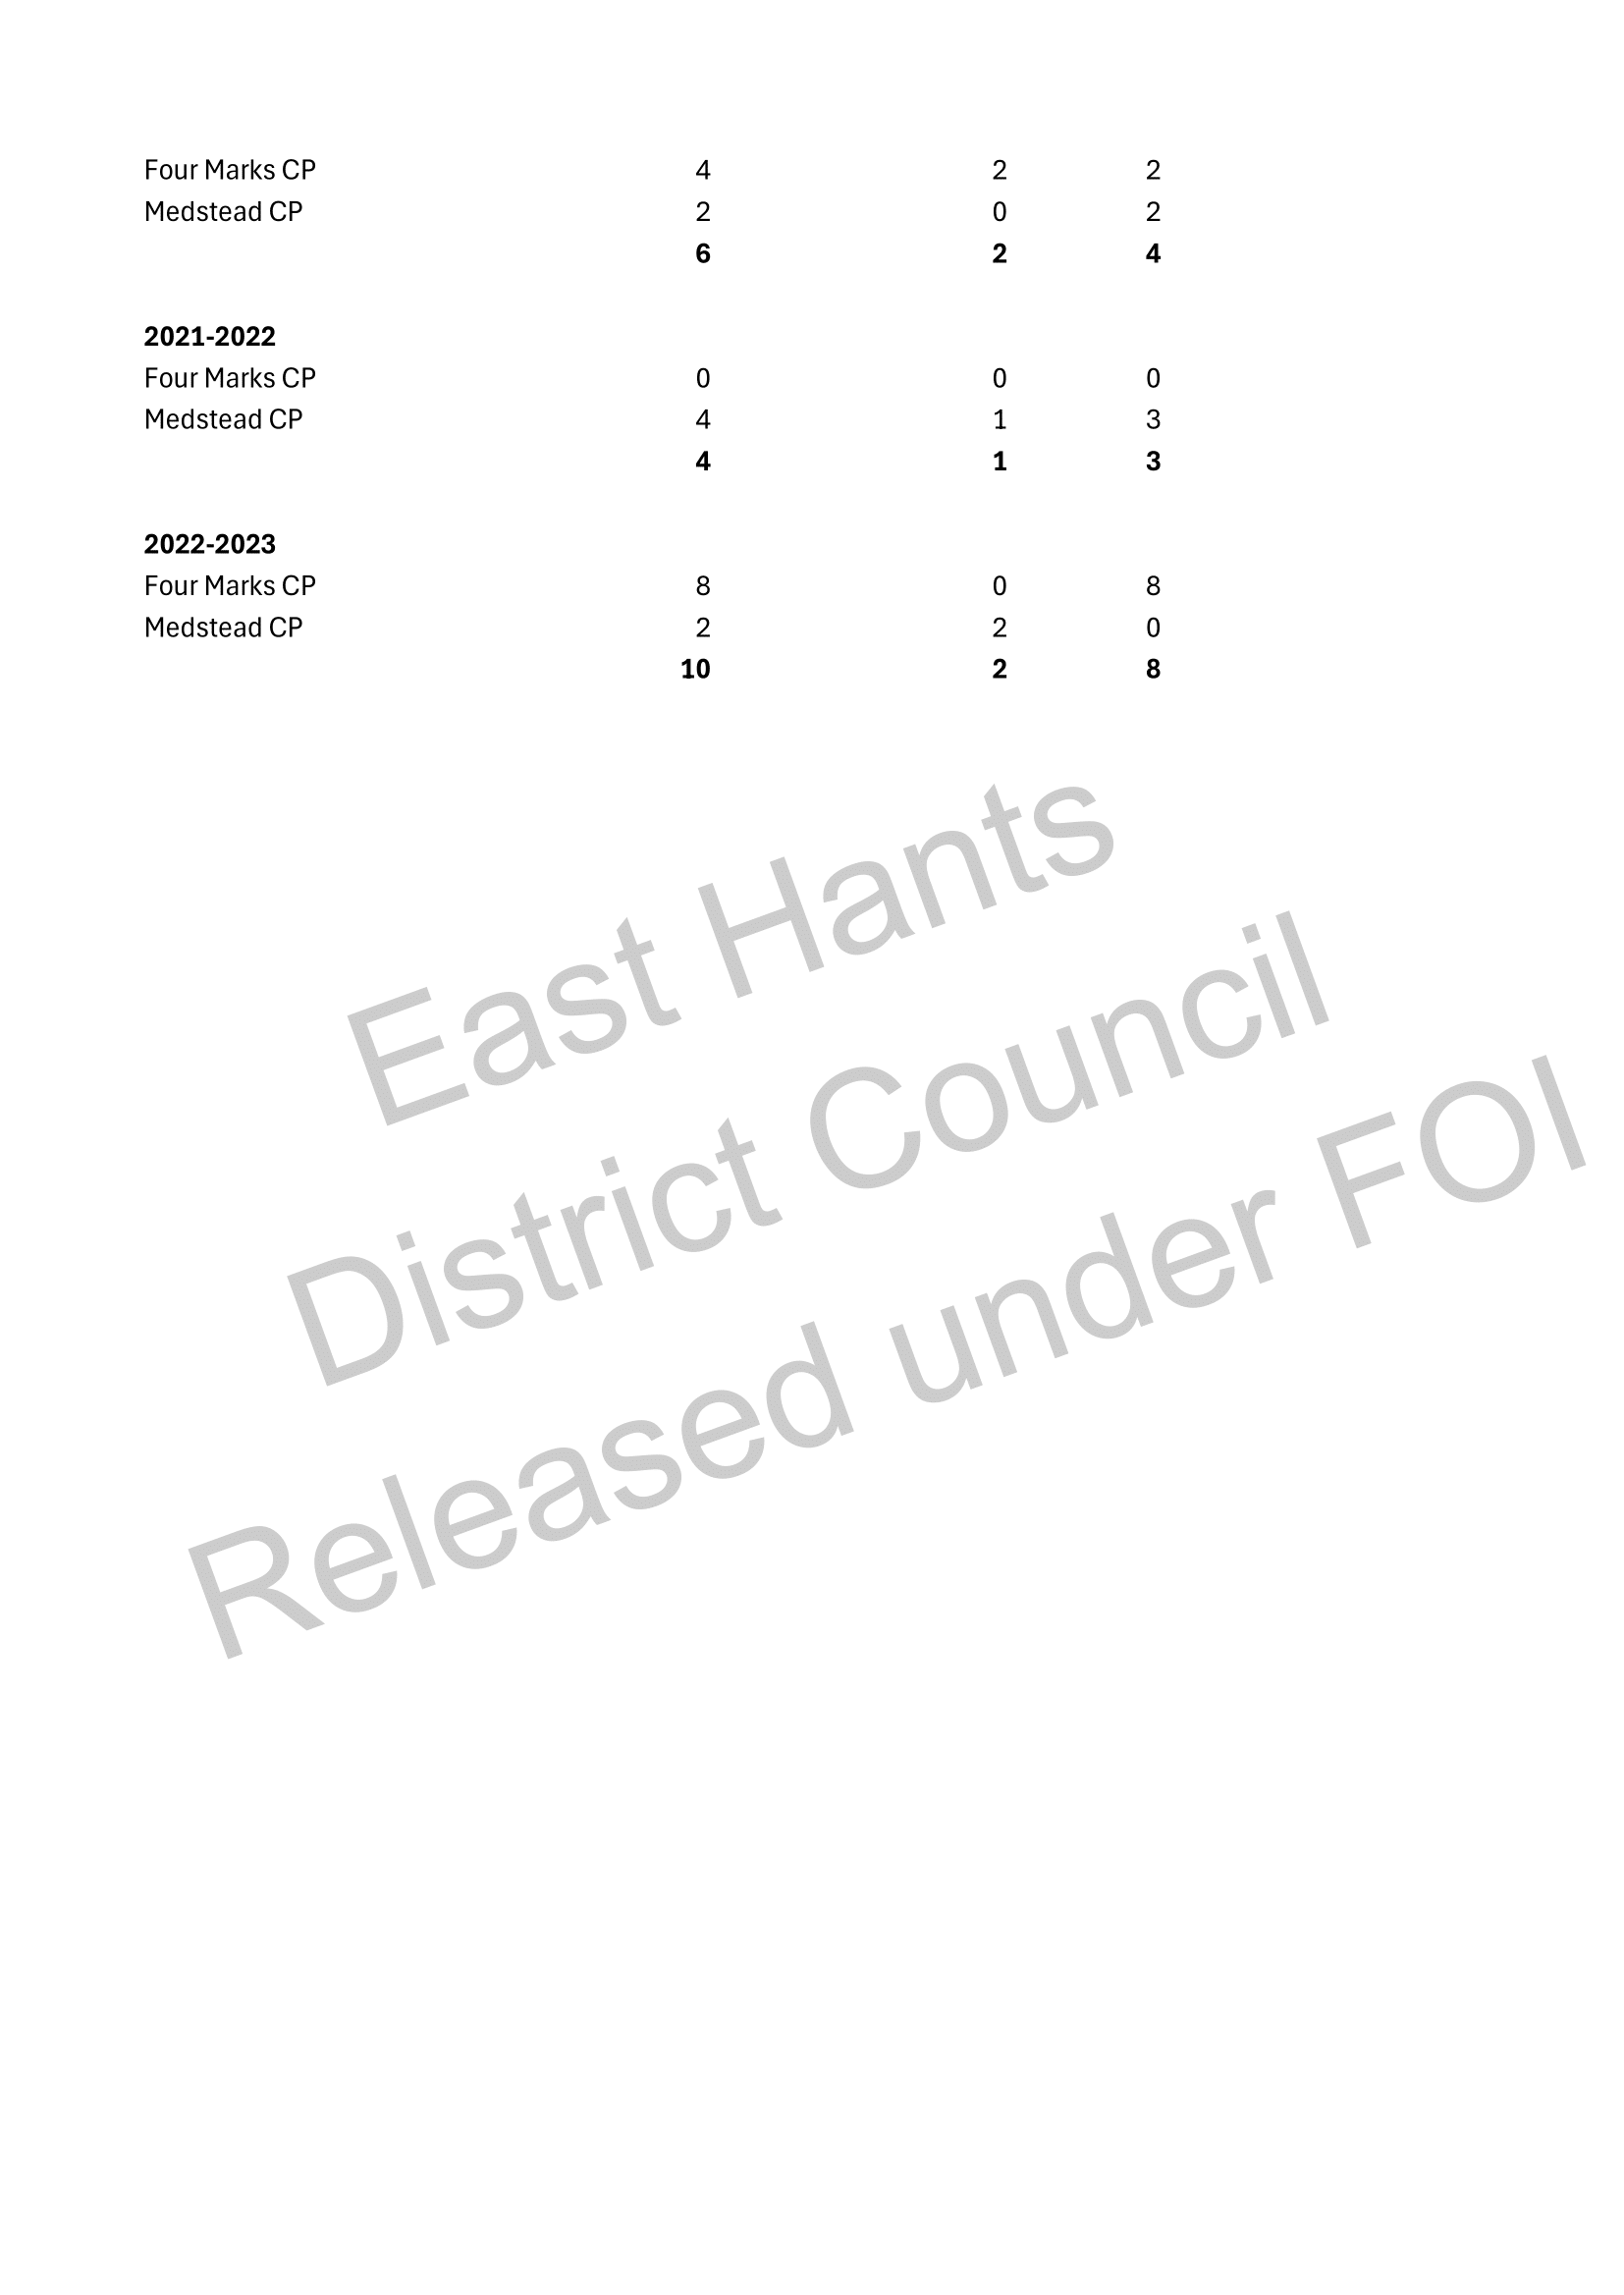
 Proportionality of Development in Medstead (2011–2021)
- Dwelling completions in Medstead (net gain): 410
- Dwelling completions across East Hampshire District (EHDC): 4,906
- ➤ Medstead accounted for ~8.36% of all new dwellings in EHDC
 Population Context (2011 Census)
- Medstead population (2011): 2,036
- EHDC population (2011): 115,608
- ➤ Medstead represented just ~1.76% of EHDC’s total population
 Conclusion: Disproportionate Development
Despite making up only 1.76% of the district’s population, Medstead absorbed 8.36% of all new housing in the 2011–2021 period.
This shows a development burden over four times higher than what would be expected if housing were distributed in proportion to population size.
 This is strong, quantitative evidence that development in Medstead was not proportionate. It supports arguments about infrastructure strain, planning fairness, and unsustainable growth at the local level.